logo
StreamShapers Ferryman

Turn animations into editable broadcast graphics.

Import your Lottie animation, configure editable fields, connect data and export HTML or OGraf templates — directly in your browser.

Your animation. Your content. Ready for the next production.

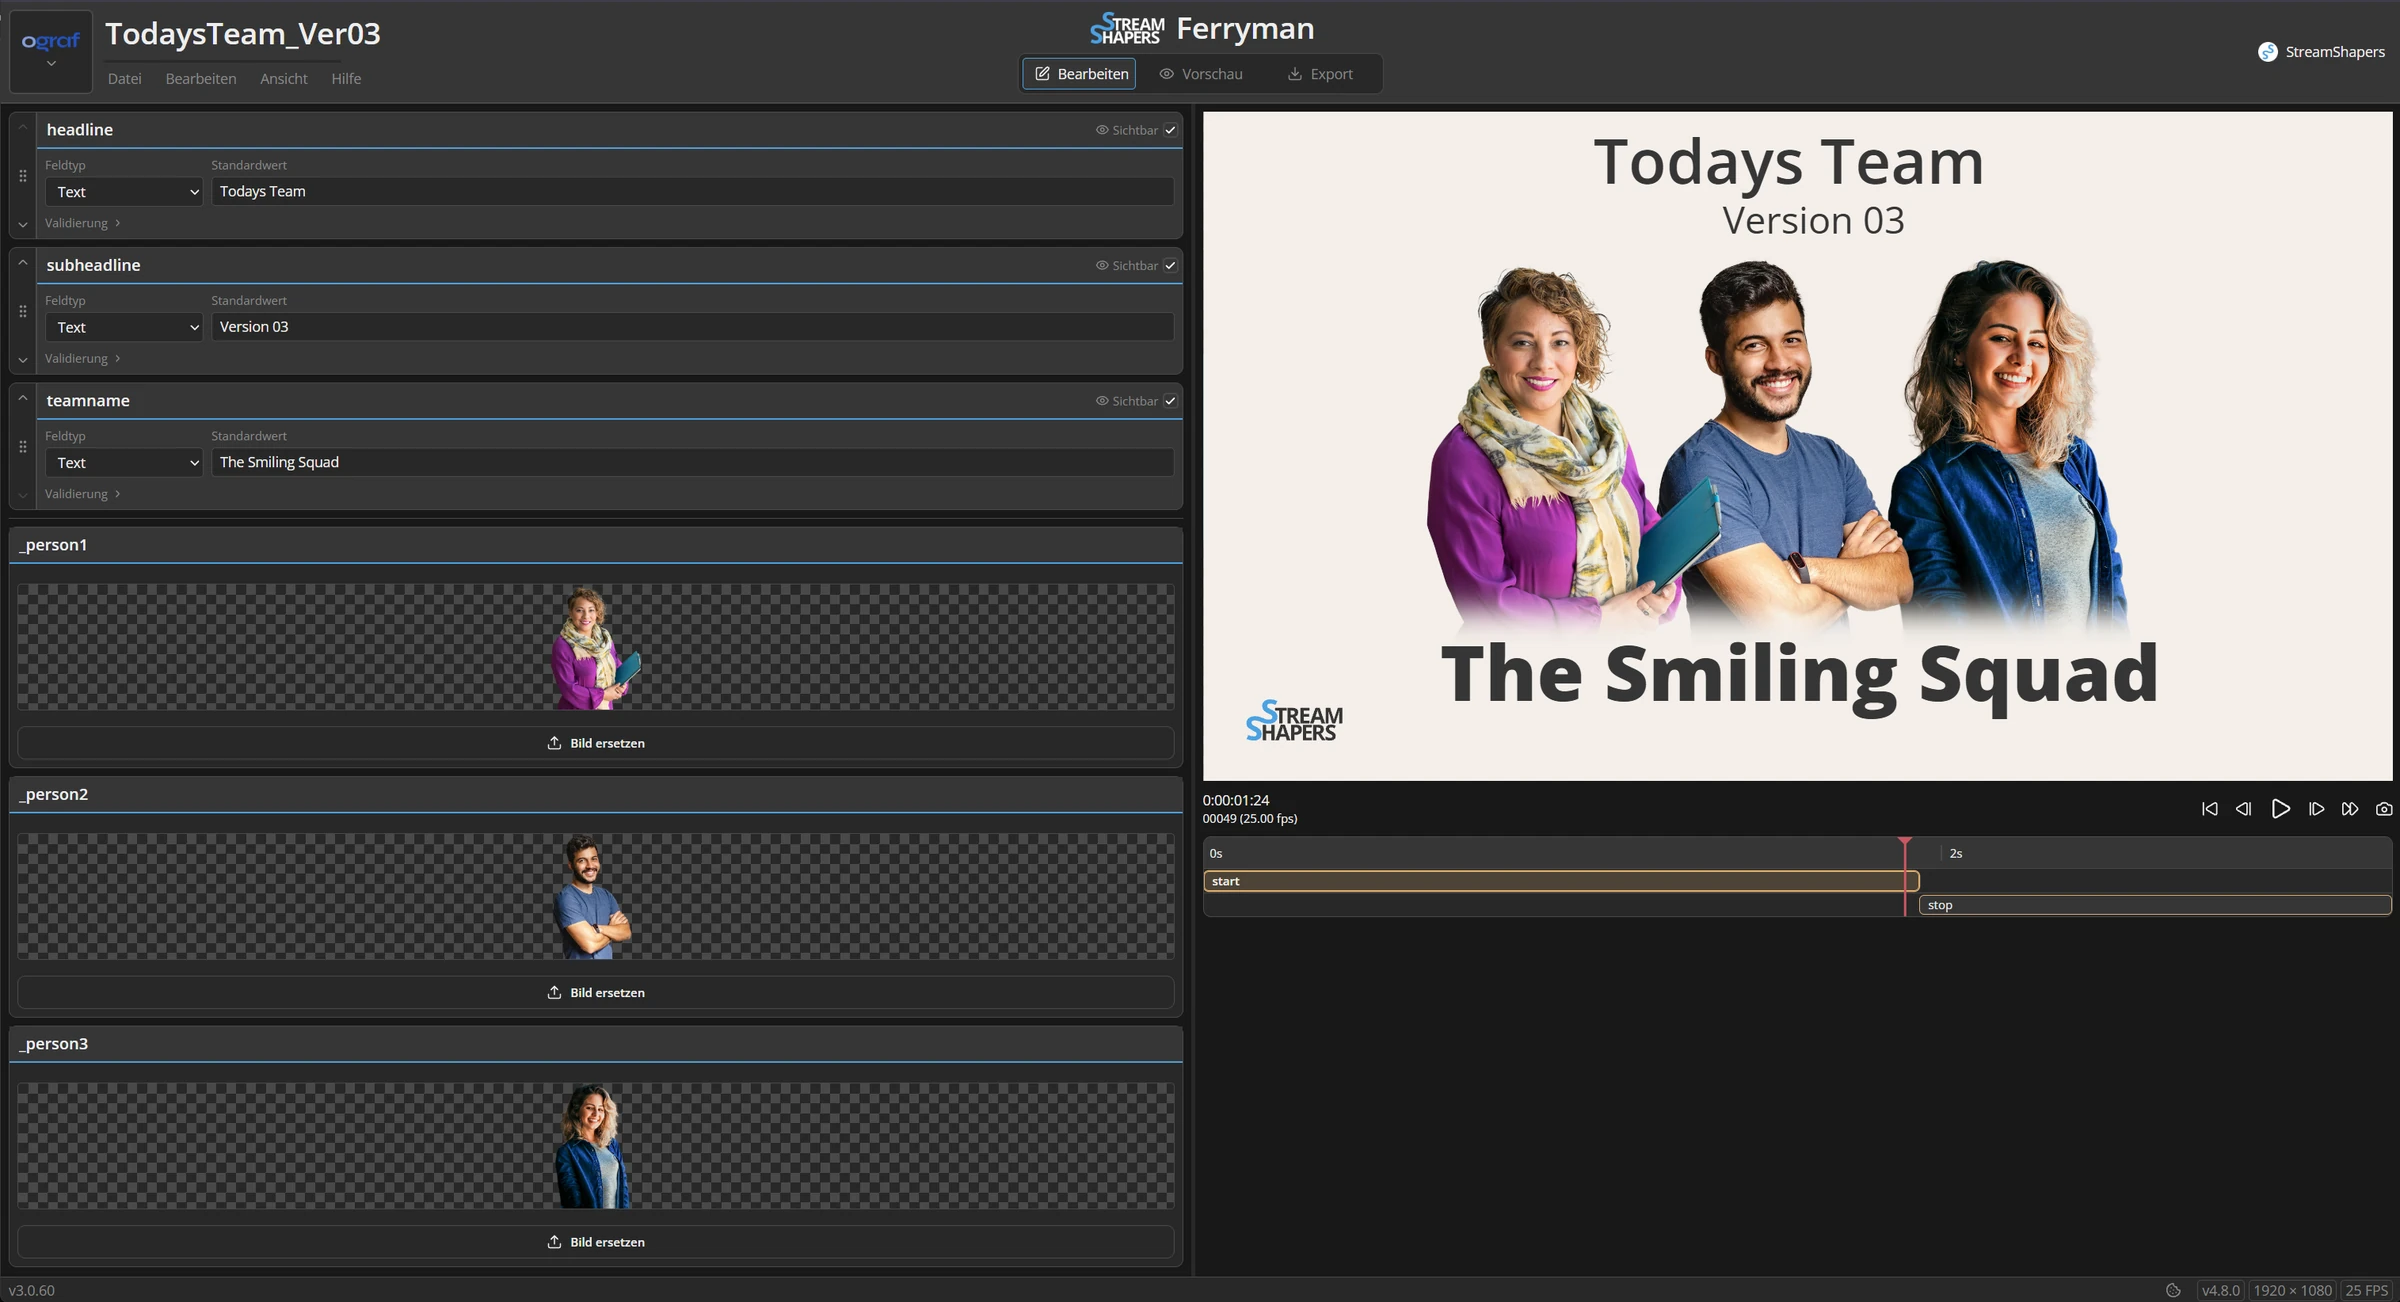
Ferryman browser editor with editable text and image fields beside a team graphic.
A team name field with its label, text input type and default value.
From animation to template

Four steps. One browser workspace.

01

Import

Drop in your Lottie animation or start with a sample.
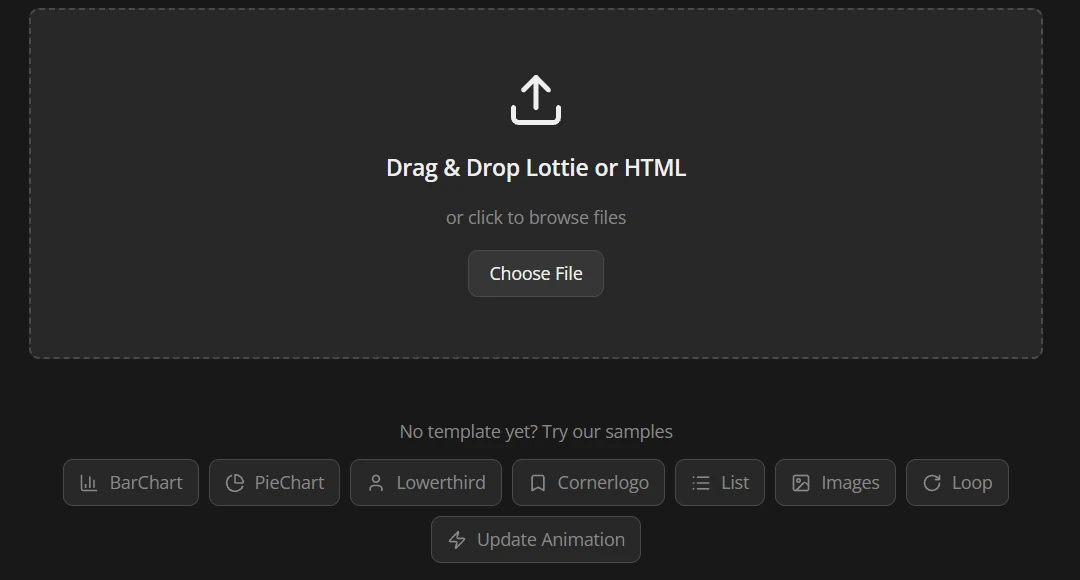
Drag and drop a Lottie or HTML file into Ferryman, or choose a sample template.
02

Configure

Choose editable fields, default values and data sources.

A team name field with its label, text input type and default value.
03

Preview

Try your content and check the animation in action.
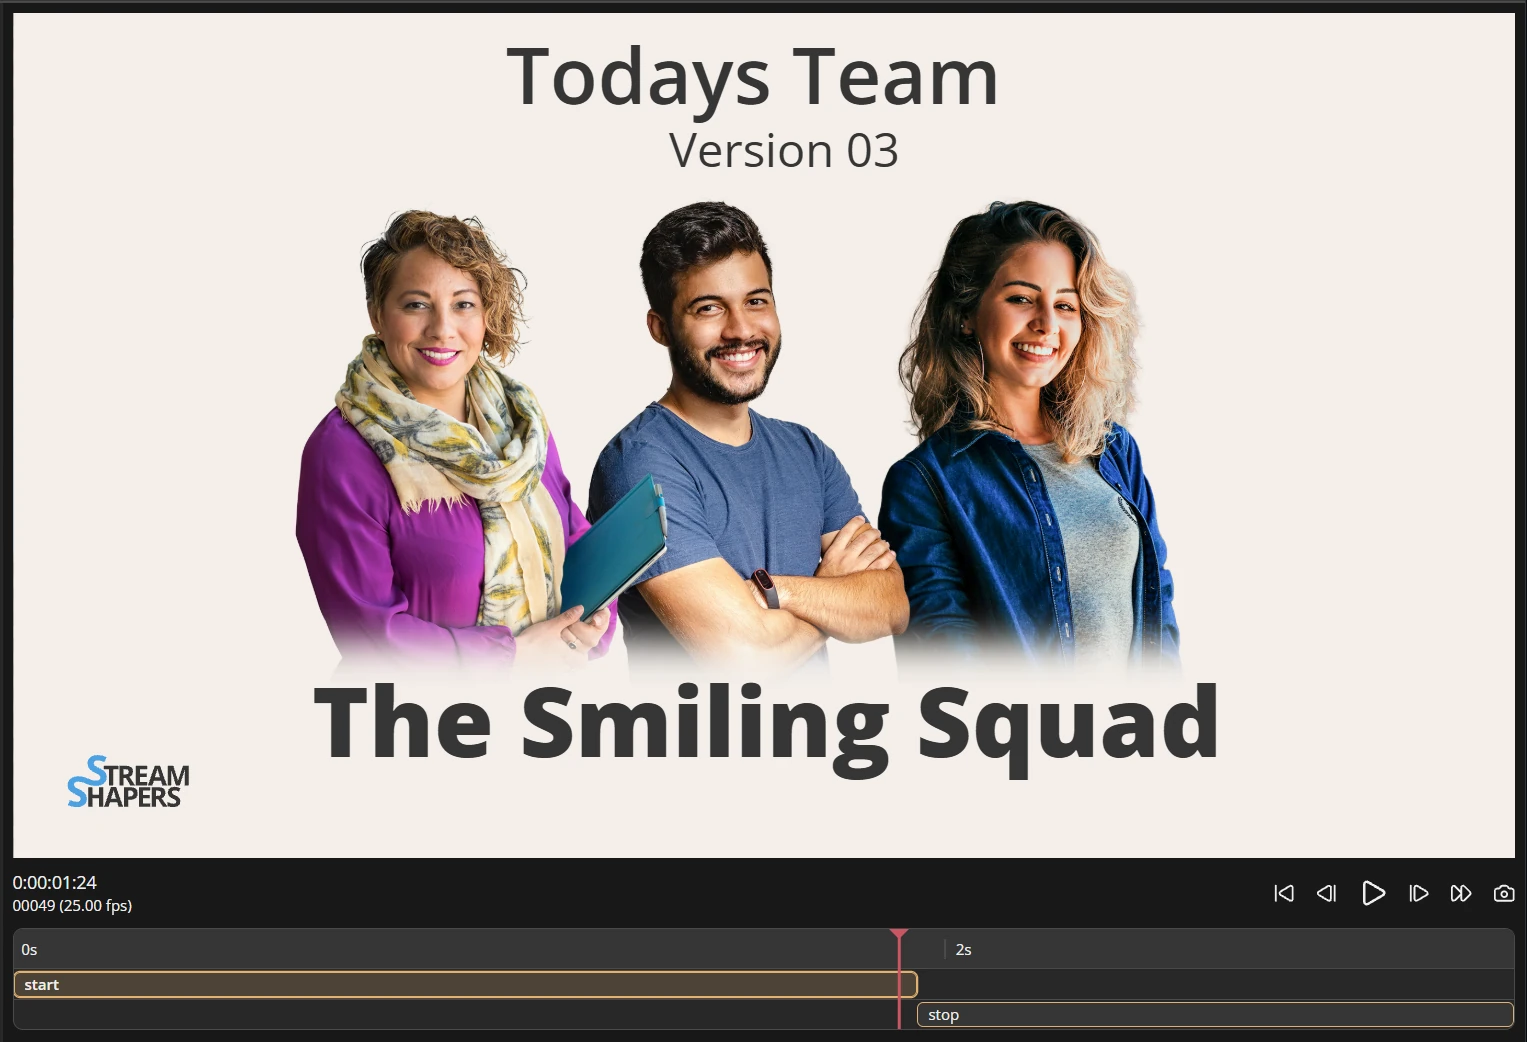
A team graphic in the animation preview with playback controls and a marker timeline.
04

Export

Download an HTML or OGraf template for your workflow.
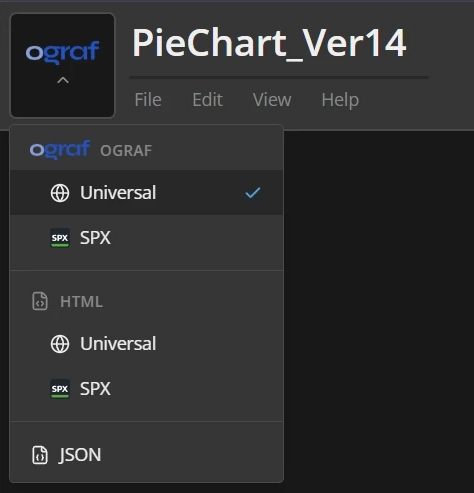
Export menu offering OGraf Universal, OGraf SPX, HTML Universal, HTML SPX and JSON.
01 / Editable content

Make your graphics editable.

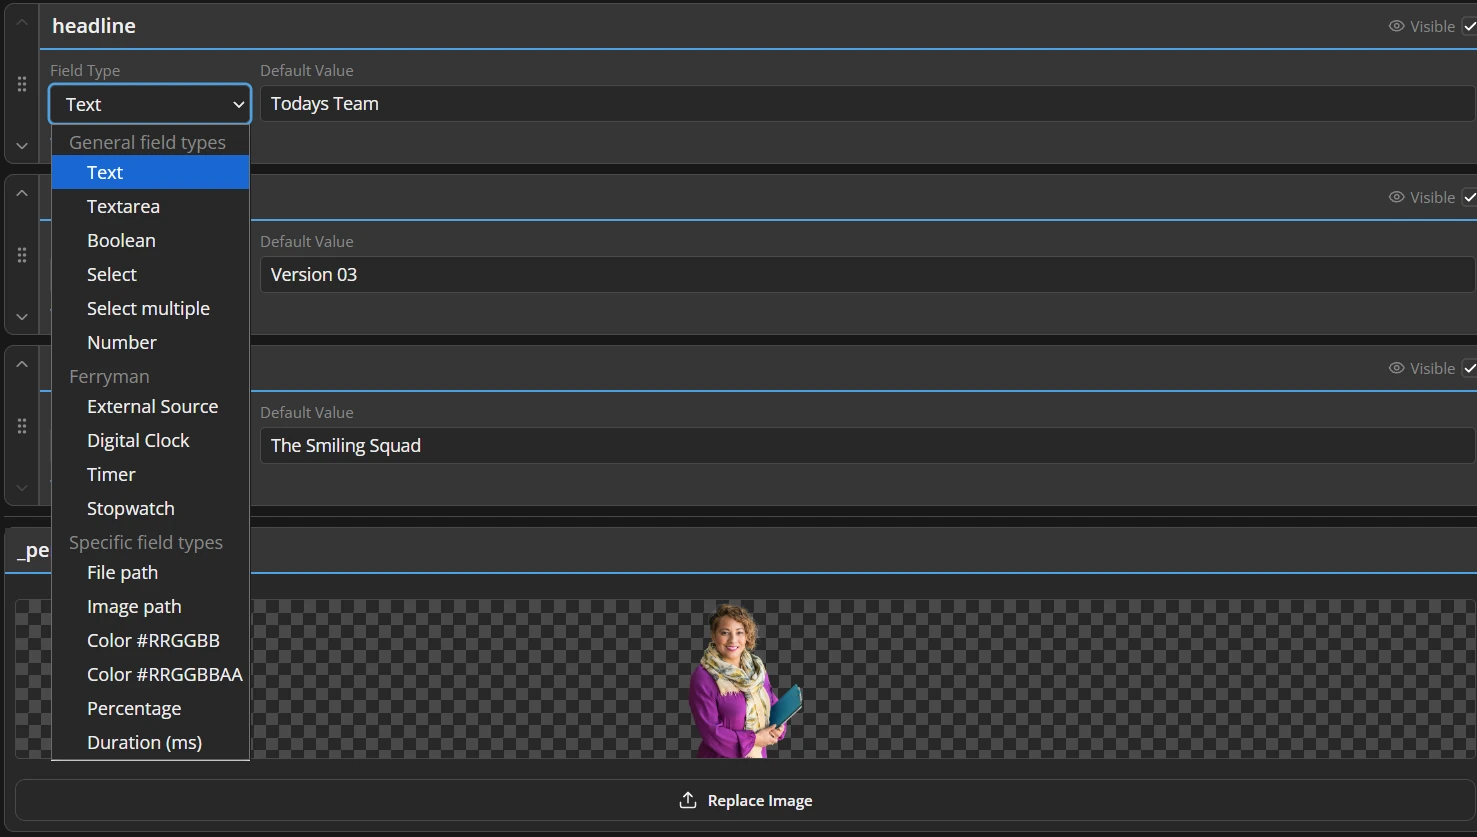
Give every template the right fields. Set labels and default values, choose input types, and replace images without rebuilding your animation.
  • Text, numbers, selections and more
  • Clear labels and a field order that makes sense
  • Reusable graphics with new names, portraits and logos
Field type menu with text, number, selection, image, colour and dynamic field options.
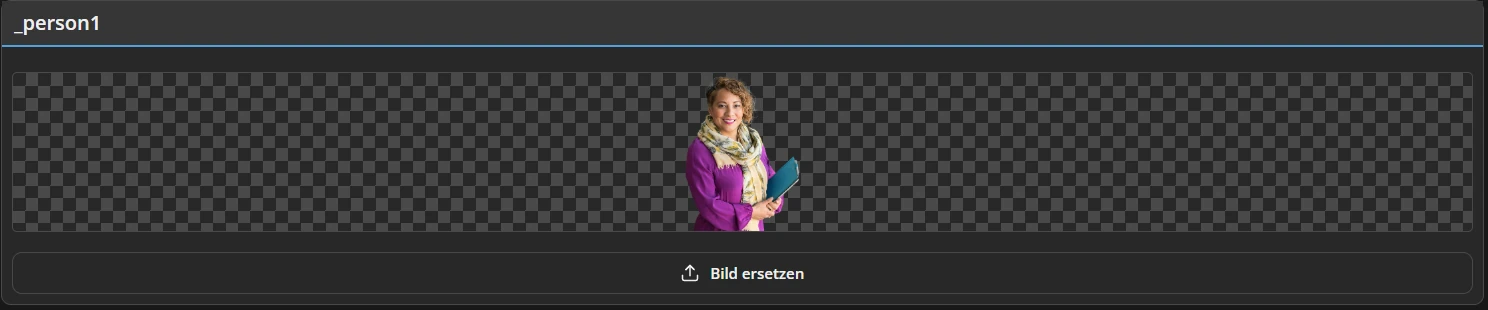
An editable portrait image field with a Replace Image button.
Change the image. Keep the design.
OGraf Universal

Give text a little structure.

Set minimum and maximum text lengths for your OGraf Universal fields, so the template carries the input rules with it.
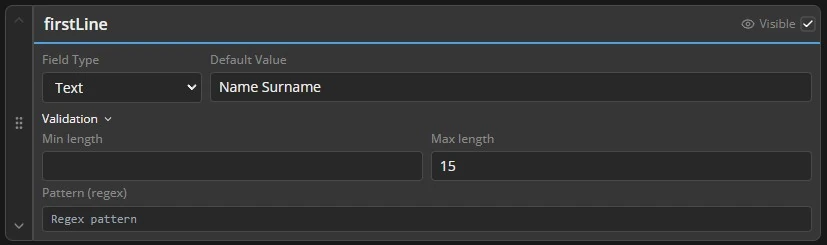
OGraf Universal text field validation with a maximum length of 15 characters.
02 / Connected data

Connect your graphics to Google Sheets.

Bring spreadsheet values into your template. Add a publicly accessible Google Sheet, then choose the cell each field should read.
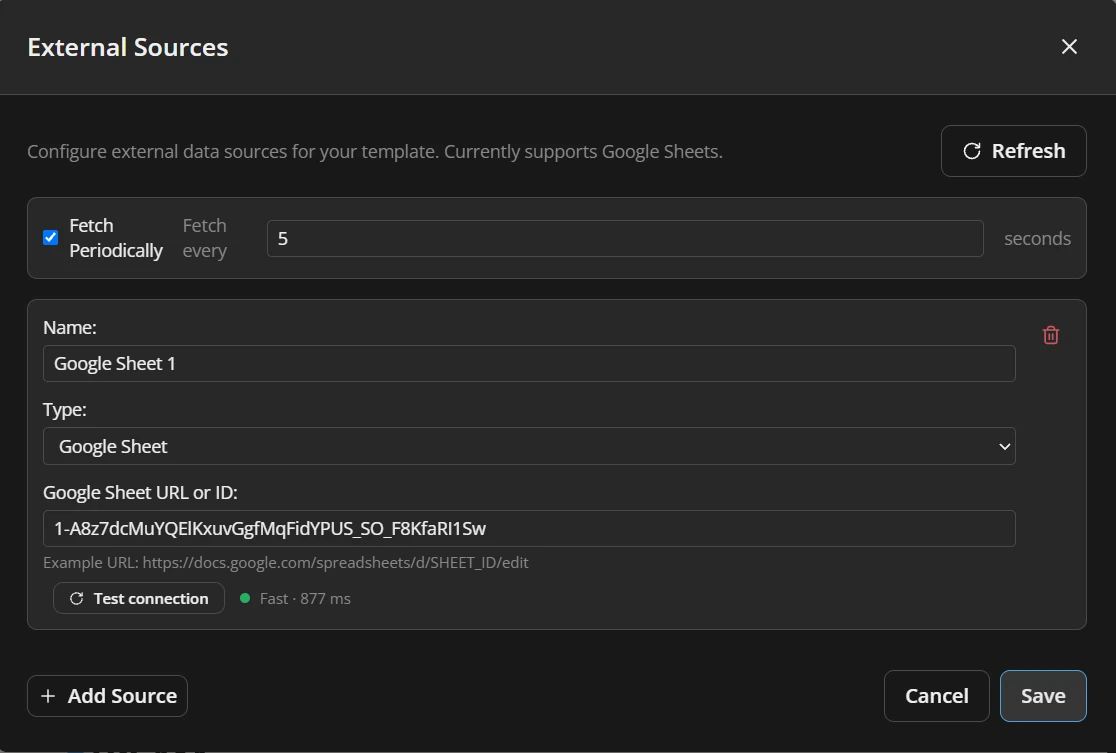
  • Test the connection before you export
  • Map individual fields to specific cells
  • Configure periodic refresh for changing data
A Google Sheets data source with a successful connection test and periodic refresh.
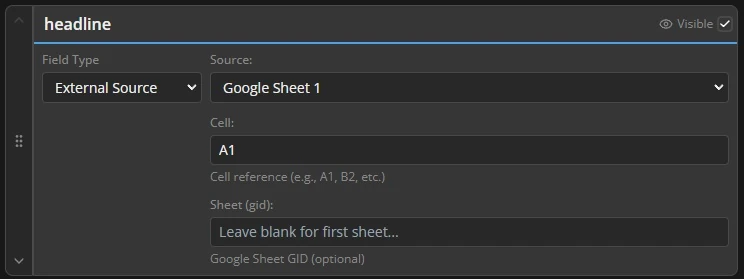
An external source field linked to Google Sheet 1, cell A1, with an optional sheet ID.
03 / Preview & timing

Check every step before export.

Try different values, play and stop your graphic, and check updates in the preview. Use markers to define how your animation enters, advances and exits.
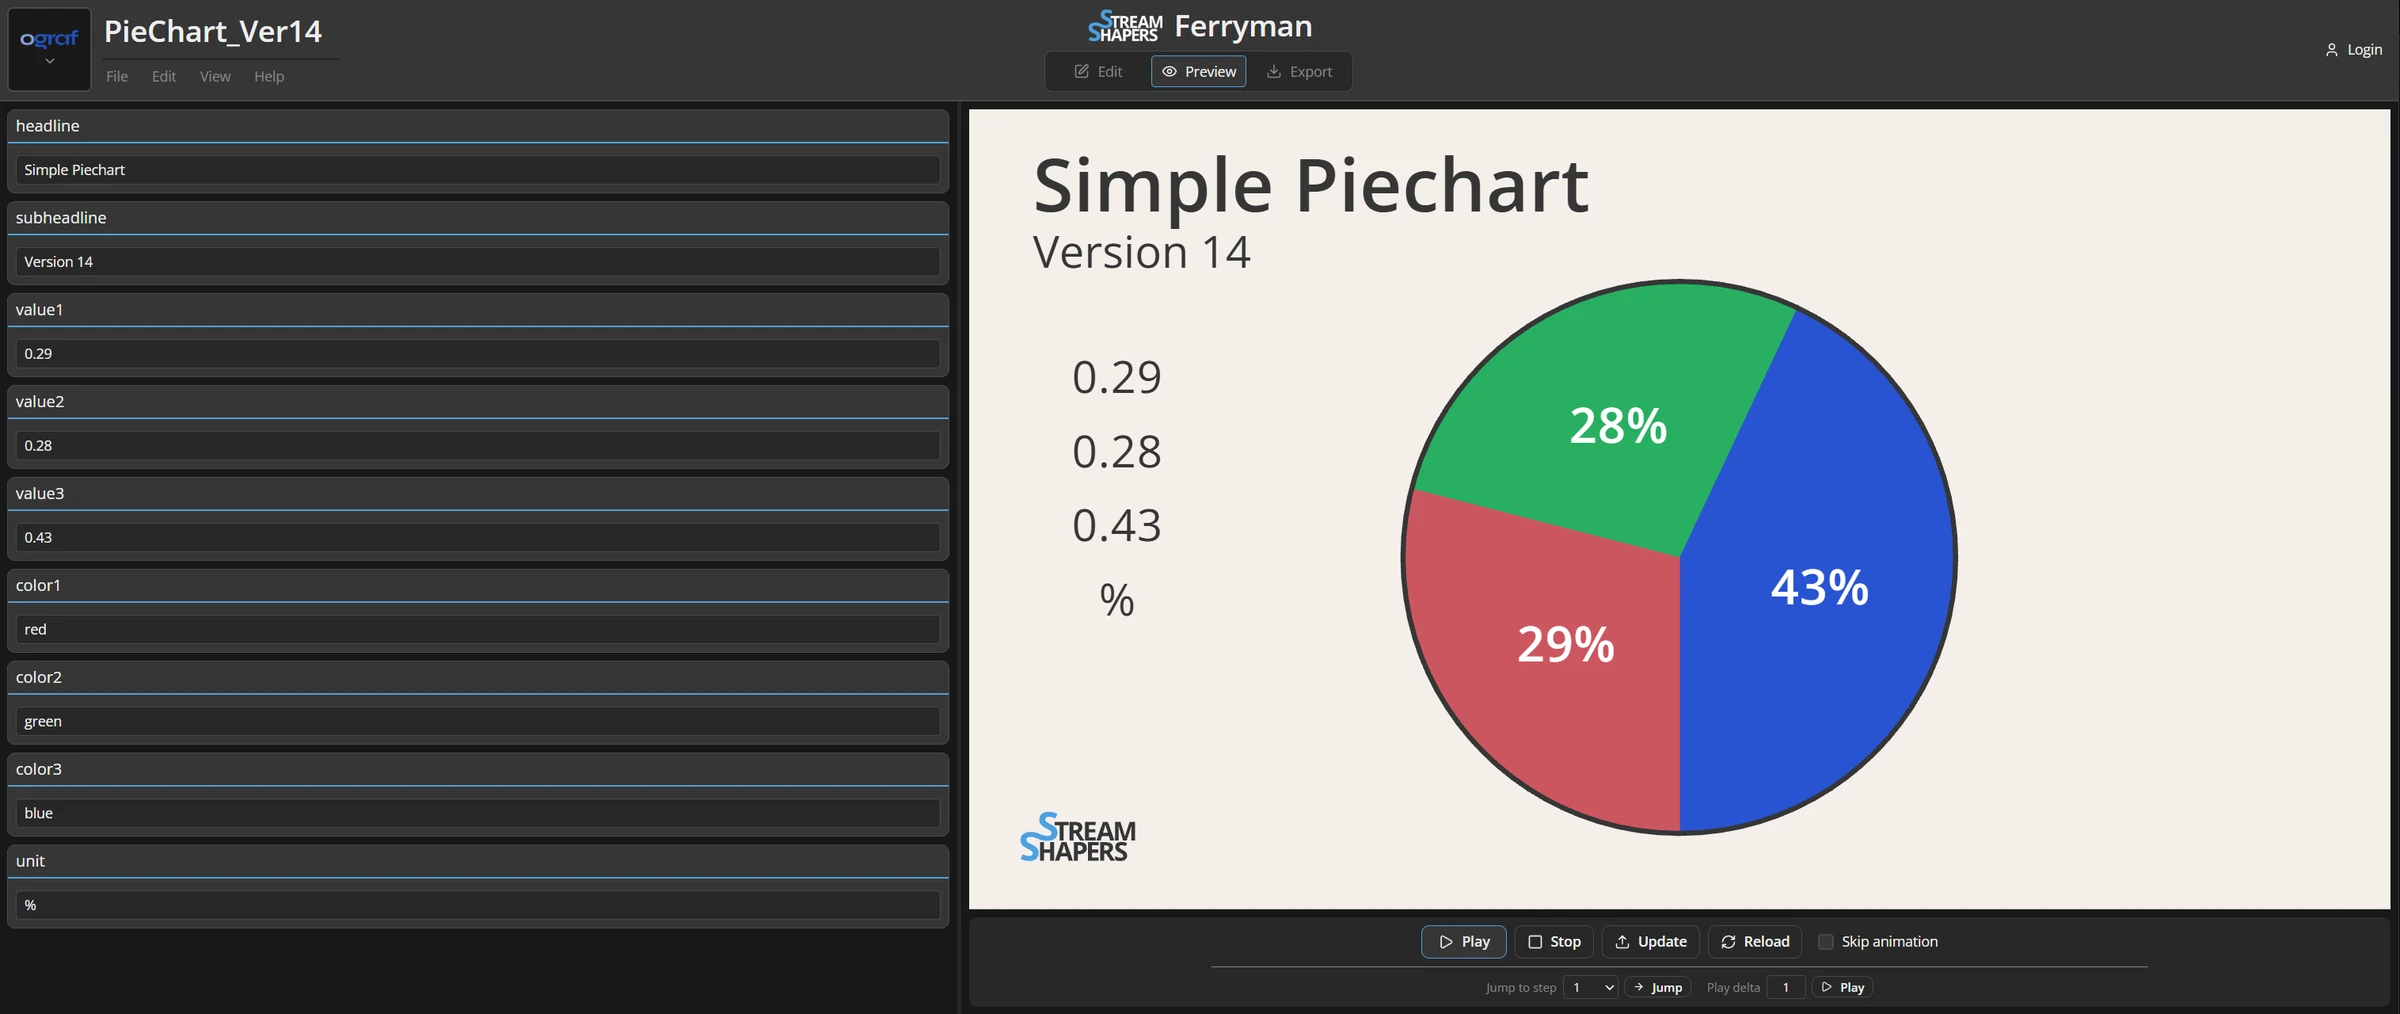
A pie chart in Ferryman Preview with editable values and Play, Stop, Update and step controls.
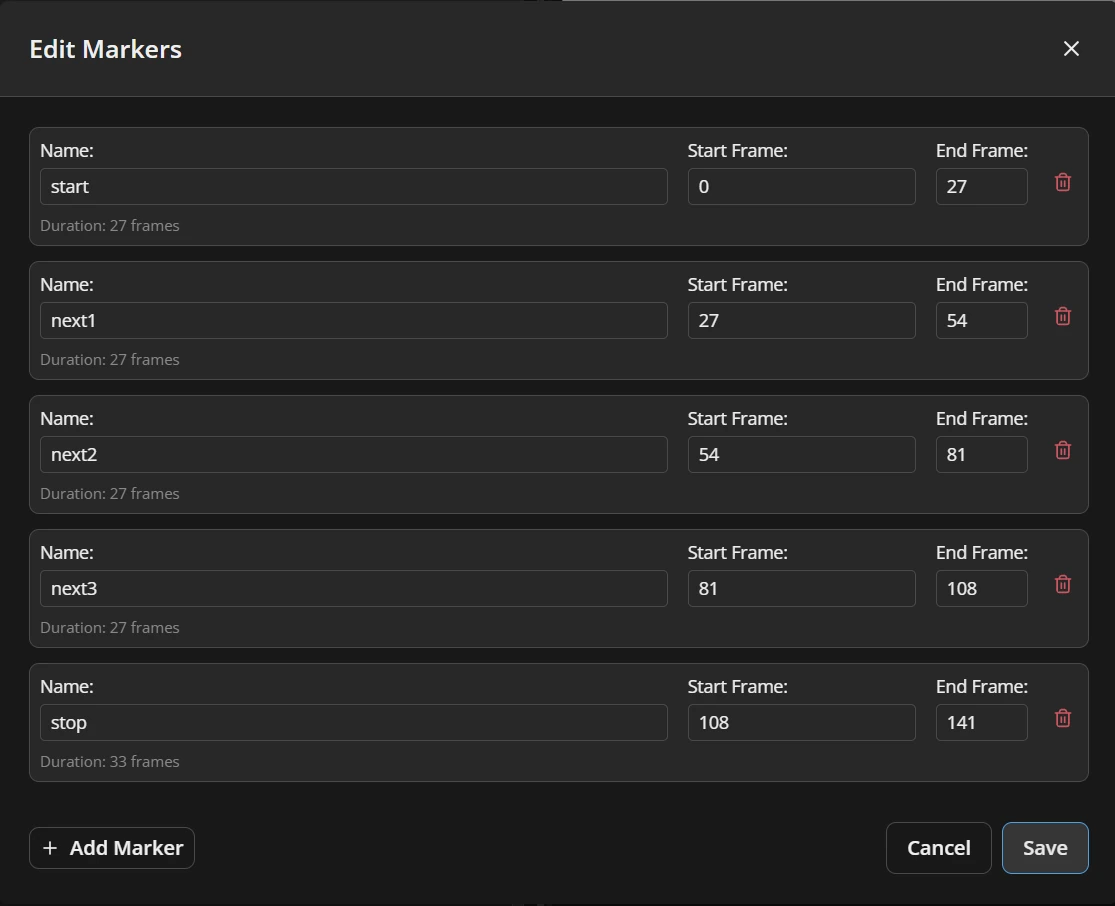
Marker editor with start, next and stop steps and their frame ranges.
Fine-tune the start, next and stop steps.
04 / Ready to deliver

Export for your graphics workflow.

Choose your output, add the template details and select a thumbnail. Download your graphic with the configuration you have prepared in Ferryman.
OGraf
Universal and SPX variants for OGraf workflows.
HTML
Universal and SPX variants for HTML template workflows.
JSON
Save your work and return to it for further editing.
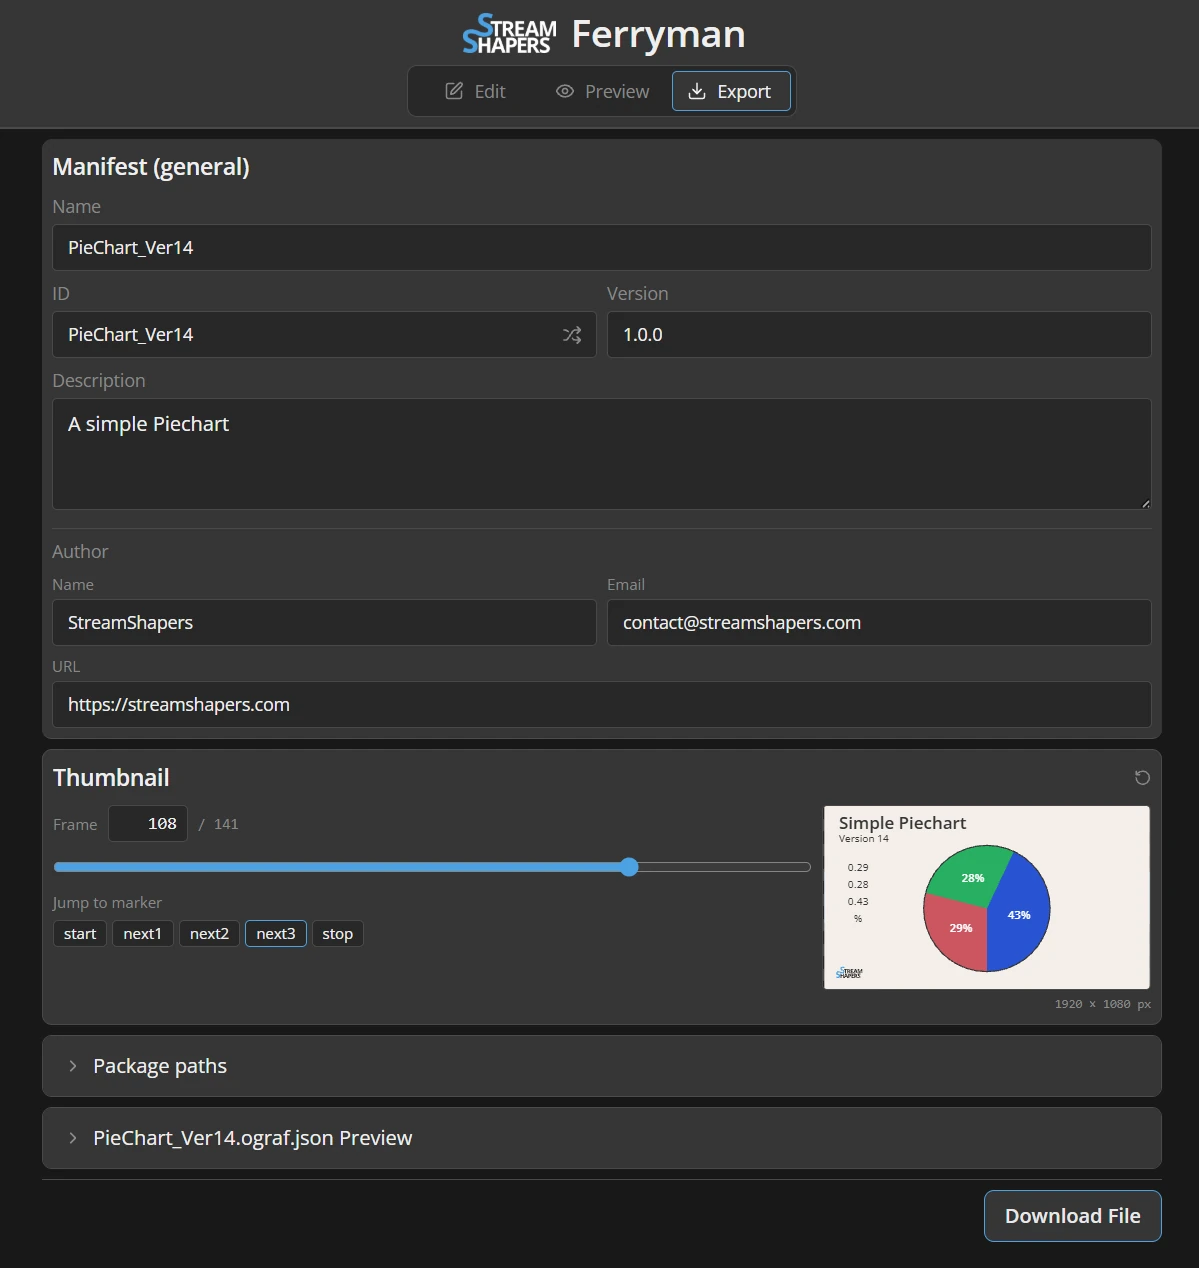
OGraf export settings with template metadata, author details and a thumbnail selector.
Export menu offering OGraf Universal, OGraf SPX, HTML Universal, HTML SPX and JSON.
Open your next graphic

Your next template starts here.

Bring an animation, or explore a sample. Make it yours in Ferryman.